.packedbubble
class: PackedBubbleOptions
- class PackedBubbleOptions(**kwargs)[source]
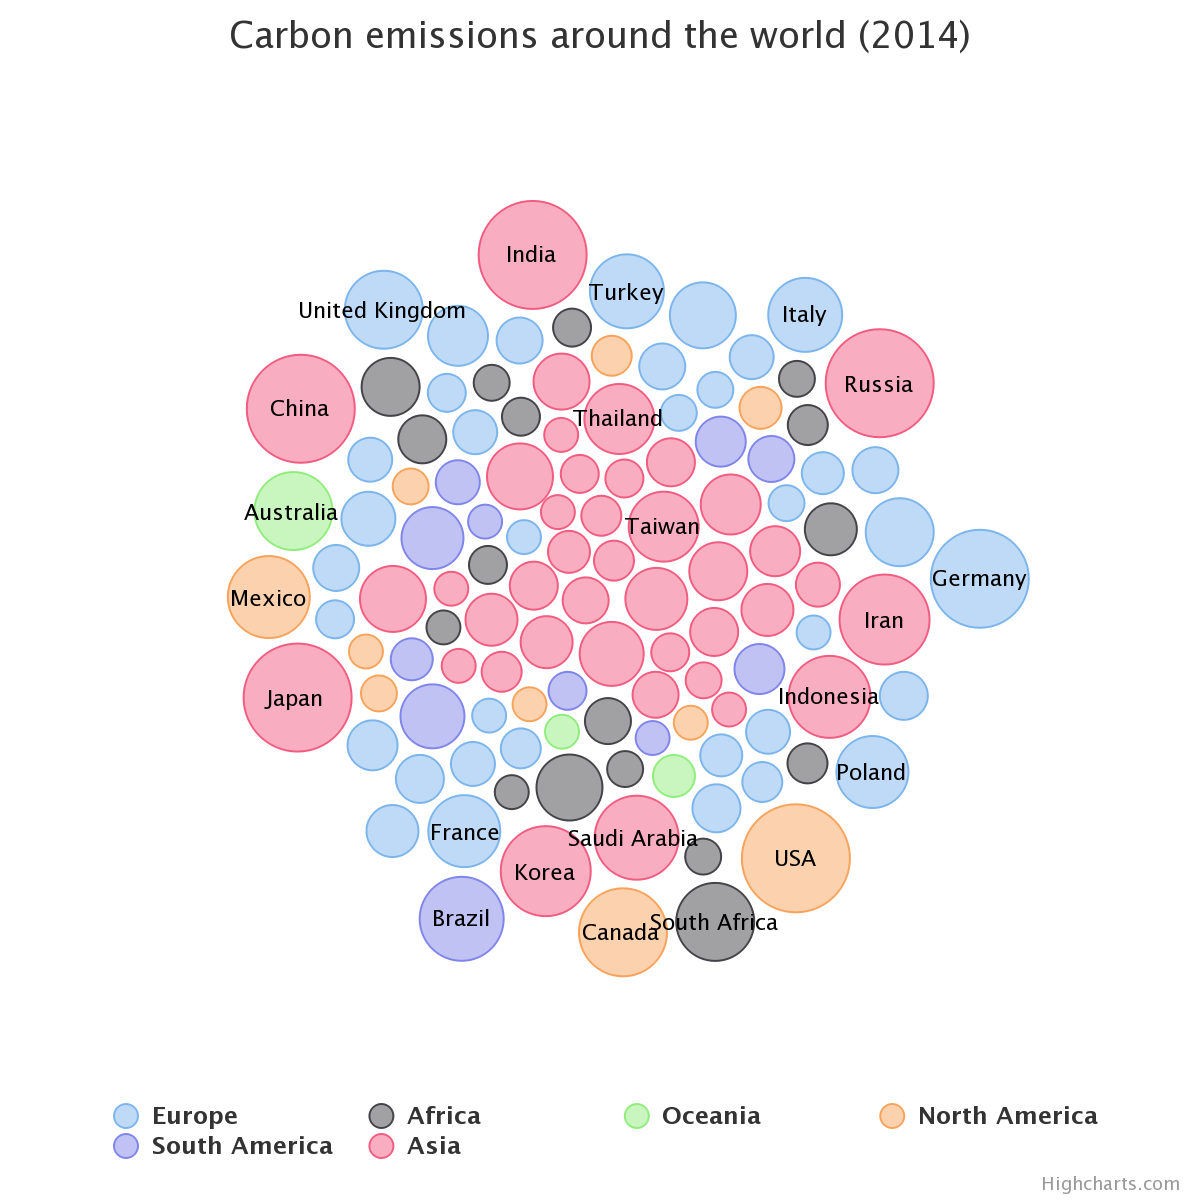
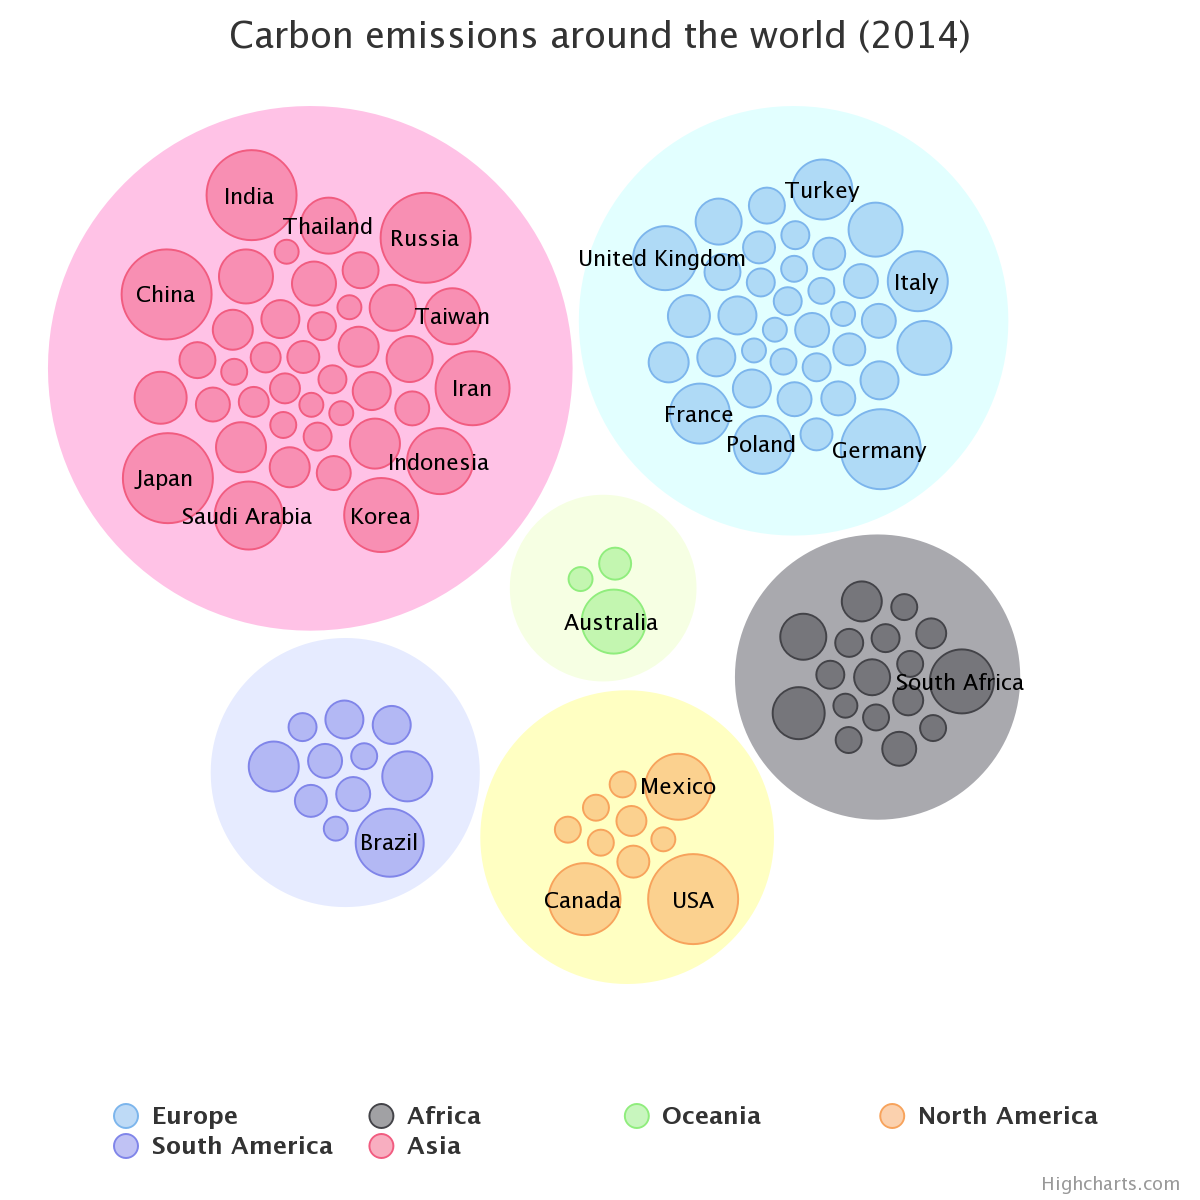
General options to apply to all Packed Bubble series types.
A packed bubble series is a two dimensional series type, where each point renders a value in X, Y position. Each point is drawn as a bubble where the bubbles don’t overlap with each other and the radius of the bubble relates to the value.
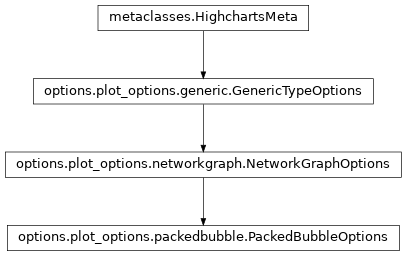
Class Inheritance
- copy(other=None, overwrite=True, **kwargs)
Copy the configuration settings from this instance to the
otherinstance.- Parameters:
other (
HighchartsMeta) – The target instance to which the properties of this instance should be copied. IfNone, will create a new instance and populate it with properties copied fromself. Defaults toNone.overwrite (
bool) – ifTrue, properties inotherthat are already set will be overwritten by their counterparts inself. Defaults toTrue.kwargs – Additional keyword arguments. Some special descendents of
HighchartsMetamay have special implementations of this method which rely on additional keyword arguments.
- Returns:
A mutated version of
otherwith new property values
- classmethod from_dict(as_dict: dict, allow_snake_case: bool = True)
Construct an instance of the class from a
dictobject.
- classmethod from_js_literal(as_str_or_file, allow_snake_case: bool = True, _break_loop_on_failure: bool = False)
Return a Python object representation of a Highcharts JavaScript object literal.
- Parameters:
as_str_or_file (
str) – The JavaScript object literal, represented either as astror as a filename which contains the JS object literal.allow_snake_case (
bool) – IfTrue, interpretssnake_casekeys as equivalent tocamelCasekeys. Defaults toTrue._break_loop_on_failure (
bool) – IfTrue, will break any looping operations in the event of a failure. Otherwise, will attempt to repair the failure. Defaults toFalse.
- Returns:
A Python object representation of the Highcharts JavaScript object literal.
- Return type:
HighchartsMeta
- classmethod from_json(as_json_or_file, allow_snake_case: bool = True)
Construct an instance of the class from a JSON string.
- Parameters:
as_json_or_file – The JSON string for the object or the filename of a file that contains the JSON string.
allow_snake_case (
bool) – IfTrue, interpretssnake_casekeys as equivalent tocamelCasekeys. Defaults toTrue.
- Returns:
A Python objcet representation of
as_json.- Return type:
HighchartsMeta
- to_dict() dict
Generate a
dictrepresentation of the object compatible with the Highcharts JavaScript library.Note
The
dictrepresentation has a property structure and naming convention that is intentionally consistent with the Highcharts JavaScript library. This is not Pythonic, but it makes managing the interplay between the two languages much, much simpler.
- to_js_literal(filename=None, encoding='utf-8') str | None
Return the object represented as a
strcontaining the JavaScript object literal.
- to_json(filename=None, encoding='utf-8')
Generate a JSON string/byte string representation of the object compatible with the Highcharts JavaScript library.
Note
This method will either return a standard
stror abytesobject depending on the JSON serialization library you are using. For example, if your environment has orjson, the result will be abytesrepresentation of the string.- Parameters:
- Returns:
A JSON representation of the object compatible with the Highcharts library.
- Return type:
- static trim_dict(untrimmed: dict, to_json: bool = False) dict
Remove keys from
untrimmedwhose values areNoneand convert values that have.to_dict()methods.
- static trim_iterable(untrimmed, to_json=False)
Convert any
EnforcedNullTypevalues inuntrimmedto'null'.
- property accessibility: TypeOptionsAccessibility | None
Accessibility options for a series.
- Return type:
TypeOptionsAccessibilityorNone
- property allow_point_select: bool | None
Allow this series’ points to be selected by clicking on the graphic (columns, point markers, pie slices, map areas etc).
The selected points can be handled in JavaScript by point select and unselect events, or collectively by the (JavaScript)
getSelectedPoints()function.And alternative way of selecting points is through dragging.
Defaults to
False.
- property animation: AnimationOptions | None
Enable or disable the initial animation when a series is displayed.
The animation can also be set as a configuration object. Please note that this option only applies to the initial animation of the series itself. For other animations, see
Chart.animationand theanimationparameter under the (JavaScript) API methods. The following properties are supported:defer: The animation delay time in milliseconds.duration: The duration of the animation in milliseconds.easing: Can be a string reference to an easing function set on the Math object or a function.
Warning
Due to poor performance, animation is disabled in old IE browsers for several chart types.
- Return type:
AnimationOptionsorNone
- property class_name: str | None
The additional CSS class name to apply to the series’ graphical elements.
Note
This option is additive to the default class names - it does not replace them.
- property clip: bool | None
If
False, allows the series to be rendered in the entire plot area. IfTrue, constrains where the series can be rendered within the plot area. Defaults toTrue.
- property color: str | Gradient | Pattern | None
The main color of the series.
In line type series it applies to the line and the point markers unless otherwise specified. In bar type series it applies to the bars unless a color is specified per point. The default value is pulled from the
Options.colors()array.
- property color_index: int | None
When operating in styled mode, a specific color index to use for the series, so that its graphic representations are given the class name
highcharts-color-{n}.Defaults to
None.
- property crisp: bool | None
If
True, each point or column edge is rounded to its nearest pixel in order to render sharp on screen. Defaults toTrue.Hint
In some cases, when there are a lot of densely packed columns, this leads to visible difference in column widths or distance between columns. In these cases, setting
crisptoFalsemay look better, even though each column is rendered blurry.
- property cursor: str | None
The style of cursor to use when the user’s mouse hovers over the data series.
Acceptable values are:
'alias''all-scroll''auto''cell''col-resize''context-menu''copy''crosshair''default''e-resize''ew-resize''grab''grabbing''help''move''n-resize''ne-resize''nesw-resize''no-drop''none''not-allowed''ns-resize''nw-resize''nwse-resize''pointer''progress''row-resize''s-resize''se-resize''sw-resize''text''vertical-text''w-resize''wait''zoom-in''zoom-out'
- property custom: JavaScriptDict | None
A reserved subspace to store options and values for customized functionality.
Here you can add additional data for your own event callbacks and formatter callbacks.
- property dash_style: str | None
Name of the dash style to use for the graph, or for some series types the outline of each shape.
Accepts one of the following values:
‘Dash’,
‘DashDot’,
‘Dot’,
‘LongDash’,
‘LongDashDot’,
‘LongDashDotDot’,
‘ShortDash’,
‘ShortDashDot’,
‘ShortDashDotDot’,
‘ShortDot’,
‘Solid’
- property data_labels: DataLabel | List[DataLabel] | None
Options for the series data labels, appearing next to each data point.
Note
To have multiple data labels per data point, you can also supply a collection of
DataLabelconfiguration settings.
- property description: str | None
A description of the series to add to the screen reader information about the series.
- property display_negative: bool | None
If
True, display negative sized bubbles.The threshold is given by the
z_thresholdsetting, and negative bubbles can be visualized by settingnegative_color.
- property enable_mouse_tracking: bool | None
If
True, enables mouse tracking for the series (used to capture point tooltips, click events on graphs and points, etc.). IfFalse, disables mouse tracking for the series (which can help performance). Defaults toTrue.
- property events: SeriesEvents | None
General event handlers for the series items.
Note
These event hooks can also be attached to the series at run time using the (JavaScript)
Highcharts.addEvent()function.- Return type:
SeriesEventsorNone
- property find_nearest_point_by: str | None
Determines whether the series should look for the nearest point in both dimensions or just the x-dimension when hovering the series.
If
None, defaults to'xy'for scatter series and'x'for most other series. If the data has duplicate x-values, it is recommended to set this to'xy'to allow hovering over all points.Applies only to series types using nearest neighbor search (not direct hover) for tooltip.
- property include_in_data_export: bool | None
If
False, will prevent the data series from being included in any form of data export. Defaults toTrue.
- property keys: List[str] | None
An array specifying which option maps to which key in the data point array.
This makes it convenient to work with unstructured data arrays from different sources.
- property label: SeriesLabel | None
Series labels are placed as close to the series as possible in a natural way, seeking to avoid other series. The goal of this feature is to make the chart more easily readable, like if a human designer placed the labels in the optimal position.
Note
The series labels currently work with series types having a graph or an area.
- Return type:
SeriesLabelorNone
- property layout_algorithm: LayoutAlgorithm | None
Configuration of how to lay out the Network Graph.
- Return type:
LayoutAlgorithmorNone
- property line_width: int | float | Decimal | None
Pixel width of the graph line. Defaults to
2.- Return type:
numeric or
None
- property link: LinkOptions | None
Link style options.
- Return type:
LinkOptionsorNone
- property linked_to: str | None
The id of another series to link to.
Hint
The value can be
':previous'to link to the previous series. When two series are linked, only the first one appears in the legend. Toggling the visibility of this also toggles the linked series.Note
If the master series uses data sorting and linked series does not have its own sorting definition, the linked series will be sorted in the same order as the master one.
- property marker: Marker | None
Options for the point markers of line-like series.
Properties like
fill_color,line_colorandline_widthdefine the visual appearance of the markers. Other series types, like column series, don’t have markers, but have visual options on the series level instead.- Return type:
MarkerorNone
- property max_size: str | int | float | Decimal | None
Maximum bubble size. Defaults to
'20%'.If
None, bubbles will automatically size between themin_sizeandmax_size, to reflect the z value of each bubble. Can be either pixels (when no unit is given), or a percentage of the smallest one of the plot width and height.- Return type:
numeric or
None
- property min_size: str | int | float | Decimal | None
Minimum bubble size. Defaults to
8.If
None, bubbles will automatically size between themax_sizeandmin_size, to reflect the z value of each bubble. Can be either pixels (when no unit is given), or a percentage of the smallest one of the plot width and height.- Return type:
numeric or
None
- property on_point: OnPointOptions | None
Options for the Series on point feature, which is currently only supported by
pieandsunburstchargs.- Return type:
OnPointOptionsorNone
- property opacity: float | None
Opacity of a series parts: line, fill (e.g. area), and labels.
- Return type:
- property parent_node: ParentNodeOptions | None
Series options for parent nodes.
- Return type:
- property point_description_formatter: CallbackFunction | None
Same as for
Accessibility.series.description_formatter(), only for an individual series. Overrides the chart-wide configuration.- Return type:
CallbackFunctionorNone
- property relative_x_value: bool | None
When
True, X values in the data set are relative to the currentpoint_start,point_interval, andpoint_interval_unitsettings. This allows compression of the data for datasets with irregular X values. Defaults toFalse.The real X values are computed on the formula
f(x) = ax + b, whereais thepoint_interval(optionally with a time unit given bypoint_interval_unit), andbis thepoint_start.
- property selected: bool | None
If
True, the series is selected initially (by default, without user interaction). Defaults toFalse.Note
If
GenericTypeOptions.show_checkbox()isTrue, then the checkbox will be checked ifselectedisTrue.
- property shadow: bool | ShadowOptions | None
Configuration for the shadow to apply to the tooltip. Defaults to
False.If
False, no shadow is applied.- Returns:
The shadow configuration to apply or a boolean setting which hides the shadow or displays the default shadow.
- Return type:
boolorShadowOptions
- property show_checkbox: bool | None
If
True, a checkbox is displayed next to the legend item to allow selecting the series.Note
The state of the checkbox is controlled by the
GenericTypeOptions.selected()property.
- property show_in_legend: bool | None
Whether to display this particular series or series type in the legend. Standalone series are shown in the legend by default, and linked series are not.
- property size_by: str | None
Whether the bubble’s value should be represented by the
'area'or the'width'of the bubble. The default,'area', corresponds best to the human perception of the size of each bubble.
If
True, the accessibility module will skip past this series when executing keyboard navigation.
- property states: States | None
Configuration for state-specific configuration to apply to the data series.
- Return type:
StatesorNone
- property sticky_tracking: bool | None
Sticky tracking of mouse events.
When
True, the (JavaScript)mouseOutevent on a series is not triggered until the mouse moves over another series, or out of the plot area.When
False, the (JavaScript)mouseOutevent on a series is triggered when the mouse leaves the area around the series’ graph or markers. This also implies the tooltip when not shared.When
FalseandPlotOptions.tooltip.shared()is alsoFalse, the tooltip will be hidden when moving the mouse between series.Defaults to
Truefor line and area type series, but toFalsefor columns, pies, etc.Note
The boost module will force this option because of technical limitations.
- property threshold: int | float | Decimal | EnforcedNullType | None
The Y axis value to serve as the base for the columns, for distinguishing between values above and below a threshold. Defaults to
0.If
EnforcedNullType, the columns extend from the padding Y axis minimum.- Return type:
numeric or
EnforcedNullTypeorNone
- property tooltip: Tooltip | None
A configuration object for the tooltip rendering of each single series. Properties are inherited from tooltip, but only the following properties can be defined on a series level.
- Return type:
TooltiporNone
- property turbo_threshold: int | None
When a series contains a data array longer than this value, only one dimensional arrays of numbers, or two dimensional arrays with x and y values are allowed. Also, only the first point is tested, and the rest are assumed to be the same format. This saves expensive data checking and indexing in long series. Set it to
0orNoneto disable.Defaults to
1000.Note
In boost mode, turbo threshold is forced. Only array of numbers or two dimensional arrays are allowed.
- property type: str
Indicates the type of series that is represented by this instance.
Warning
This proprety is read-only!
- Return type:
- property use_simulation: bool | None
If
True, simulation is used to calculate bubble positions. Defaults toTrue.Simulation also adds options to the series graph based on used layout. In case of big data sets, with any performance issues, it is possible to disable animation and pack bubble in a simple circular way.
- property visible: bool | None
If
True, the series is initially visible. IfFalse, the series is hidden by default. Defaults toTrue.
- property z_threshold: int | float | Decimal | None
When
display_negativeisFalse, then bubbles with a Z value lower thanz_thresholdare not rendered. Whendisplay_negativeisTrueandnegative_coloris set, then points with a Z value lower thanz_thresholdare rendered with the negative coloring.Defaults to
0.- Return type:
numeric or
None
class: ParentNodeOptions
- class ParentNodeOptions(**kwargs)[source]
Series options for parent nodes.
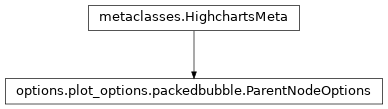
Class Inheritance
- copy(other=None, overwrite=True, **kwargs)
Copy the configuration settings from this instance to the
otherinstance.- Parameters:
other (
HighchartsMeta) – The target instance to which the properties of this instance should be copied. IfNone, will create a new instance and populate it with properties copied fromself. Defaults toNone.overwrite (
bool) – ifTrue, properties inotherthat are already set will be overwritten by their counterparts inself. Defaults toTrue.kwargs – Additional keyword arguments. Some special descendents of
HighchartsMetamay have special implementations of this method which rely on additional keyword arguments.
- Returns:
A mutated version of
otherwith new property values
- classmethod from_dict(as_dict: dict, allow_snake_case: bool = True)
Construct an instance of the class from a
dictobject.
- classmethod from_js_literal(as_str_or_file, allow_snake_case: bool = True, _break_loop_on_failure: bool = False)
Return a Python object representation of a Highcharts JavaScript object literal.
- Parameters:
as_str_or_file (
str) – The JavaScript object literal, represented either as astror as a filename which contains the JS object literal.allow_snake_case (
bool) – IfTrue, interpretssnake_casekeys as equivalent tocamelCasekeys. Defaults toTrue._break_loop_on_failure (
bool) – IfTrue, will break any looping operations in the event of a failure. Otherwise, will attempt to repair the failure. Defaults toFalse.
- Returns:
A Python object representation of the Highcharts JavaScript object literal.
- Return type:
HighchartsMeta
- classmethod from_json(as_json_or_file, allow_snake_case: bool = True)
Construct an instance of the class from a JSON string.
- Parameters:
as_json_or_file – The JSON string for the object or the filename of a file that contains the JSON string.
allow_snake_case (
bool) – IfTrue, interpretssnake_casekeys as equivalent tocamelCasekeys. Defaults toTrue.
- Returns:
A Python objcet representation of
as_json.- Return type:
HighchartsMeta
- to_dict() dict
Generate a
dictrepresentation of the object compatible with the Highcharts JavaScript library.Note
The
dictrepresentation has a property structure and naming convention that is intentionally consistent with the Highcharts JavaScript library. This is not Pythonic, but it makes managing the interplay between the two languages much, much simpler.
- to_js_literal(filename=None, encoding='utf-8') str | None
Return the object represented as a
strcontaining the JavaScript object literal.
- to_json(filename=None, encoding='utf-8')
Generate a JSON string/byte string representation of the object compatible with the Highcharts JavaScript library.
Note
This method will either return a standard
stror abytesobject depending on the JSON serialization library you are using. For example, if your environment has orjson, the result will be abytesrepresentation of the string.- Parameters:
- Returns:
A JSON representation of the object compatible with the Highcharts library.
- Return type:
- static trim_dict(untrimmed: dict, to_json: bool = False) dict
Remove keys from
untrimmedwhose values areNoneand convert values that have.to_dict()methods.
- static trim_iterable(untrimmed, to_json=False)
Convert any
EnforcedNullTypevalues inuntrimmedto'null'.